Ranking World Series Winners By Best Value For Money Over Last 30 Years

 Used 28 Times Today
 GAMBLING PROBLEM? CALL 1-800-GAMBLER or 1-800-MY-RESET (AZ, CO, IL, IN, KS, KY, LA, MD, MI, MO, NC, NJ, OH, PA, TN, VA) or 1-800-BETS OFF (IA). Call 1-800-NEXT-STEP (AZ). Call 1-800-9-WITH-IT (IN). CALL 1-877-770-STOP (LA). 21+ only (18+ in KY). Please gamble responsibly. Must be present in AZ/CO/IA/IL/IN/KS/KY/LA (select parishes)/MD/MI/MO/NC/NJ/OH/PA/TN/VA. Licensee partner Amelia Belle Casino. Minimum $10 deposit required. Minimum odds -500 or greater. Bonus Bets wager excluded from returns. New customers only. T&Cs, time limits and exclusions apply.
Which MLB team has been the best money can buy over the last 30 years? Here's a look at the squads that offered the biggest bang for their buck across all World Series winners since 1992.
The Miami Marlins are among the worst-run franchises in baseball. But the top two “Best Teams Money Can Buy” since 1992 have worn Marlins uniforms.
The 2003 and 1997 Florida Marlins delivered the most bang for their buck among World Series champions during the past 30 years, according to a Bookies.com study of baseball payrolls adjusted for inflation from 1992-2021 and total team victories (including the postseason).
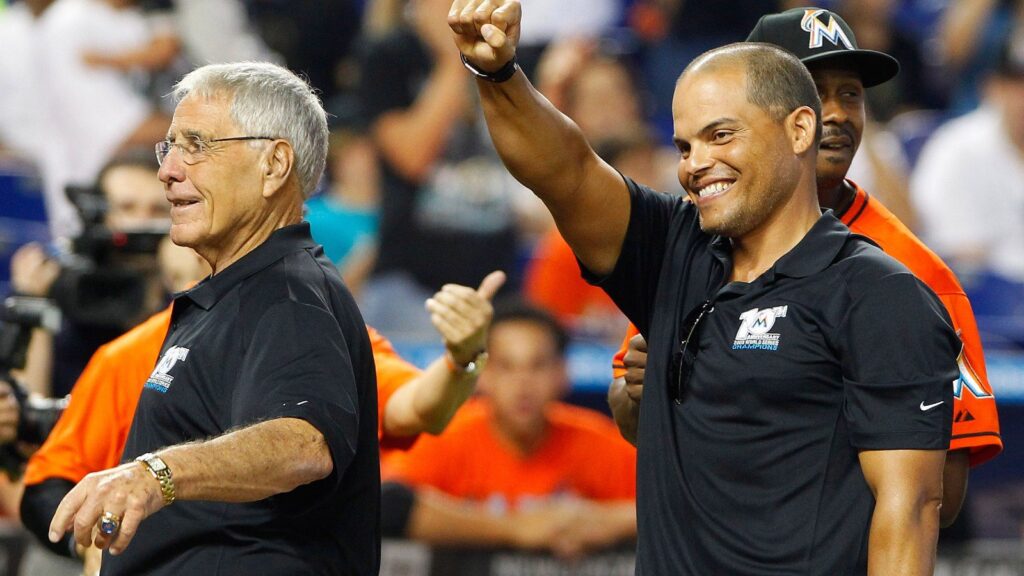
In terms of Cost Per Win (CPW) adjusted for inflation, the 2003 Marlins were the best bargain in baseball. Florida finished 91-71 in the regular season and won 12 games in the postseason, including four over the Chicago Cubs in a memorable NLCS.
The adjusted CPW for each of their 103 wins from that year is $751,389.13, or $480,882.35 in 2003 dollars. The highest-paid player on that team was catcher Ivan Rodriguez, who earned $10,000,000 in 2003, or what would equal $15,625,217.39 today.
RELATED: Top MLB Picks & Prop Bets For Today's Schedule
Best Value For Money World Series Winners Since 1992
Only four times in the past 30 years has the team with the highest payroll in baseball won the World Series in the same year: The 1993 Blue Jays, the 1999 and ‘09 New York Yankees, and the 2018 Boston Red Sox.
Here is a rundown of the World Series winners since 1992 ranked by their CPW in 2022 dollars. With inflation at a 40-year high, we've calculated the figures that way to add perspective and level the financial playing field across eras.
The teams are listed with their title year, total wins including the postseason, their adjusted and original CPW and payroll (PR), their highest-paid player that season, and that player's 2022 adjusted salary and original salary. Salary figures are rounded off in millions of dollars.
Top Baseball 'Bang For Your Buck' Teams Since 1992
| YR | TEAM | '22 CPW | '22 PR | WINS | CPW | PR | PLAYER | '22 SAL. | SAL. |
|---|---|---|---|---|---|---|---|---|---|
| 2003 | FLA | 751,389 | 76,641,691 | 102 | 480,882 | 49,500,000 | I. Rodrig. | 15.625 | 10.00 |
| 1997 | FLA | 830,486 | 85,540,053 | 103 | 463,882 | 47,753,000 | A. Fernan. | 12.539 | 7.00 |
| 1995 | ATL | 844,241 | 85,268,329 | 101 | 447,515 | 45.199,000 | G. Maddux | 12.262 | 6.50 |
| 1992 | TOR | 860,346 | 89,475,970 | 104 | 419,843 | 43,663,666 | J. Morris | 9.221 | 4.50 |
| 1993 | TOR | 883,706 | 91,021,709 | 103 | 444,152 | 45,747,666 | J. Carter | 10.943 | 5.50 |
| 1998 | NYY | 891,226 | 111,403,211 | 125 | 505,279 | 63,159,898 | B. Williams | 14.640 | 8.30 |
| 2002 | ANA | 896,722 | 98,639,389 | 110 | 561,106 | 61,721,667 | T. Salmon | 14.640 | 15.42 |
| 1996 | NYY | 928,466 | 95,631,948 | 103 | 506,693 | 52,189,370 | R. Sierra | 11.361 | 6.20 |
| 2012 | SFG | 977,669 | 102,655,260 | 105 | 780,744 | 81,978,100 | B. Zito | 23.792 | 19.00 |
| 2005 | CWS | 1,006,097 | 110,670,639 | 110 | 683,436 | 75,178,000 | P. Konerko | 12.881 | 8.75 |
| 2010 | SFG | 1,252,292 | 128,986,044 | 103 | 949,794 | 97,828,833 | B. Zito | 24.392 | 18.50 |
| 2008 | PHI | 1,274,022 | 131,224,291 | 103 | 954,077 | 98,269,880 | P. Burrell | 19.029 | 14.25 |
| 2015 | KCR | 1,292,136 | 136,966,452 | 106 | 1,065,231 | 112,914,525 | A. Gordon | 16.679 | 13.75 |
| 2011 | STL | 1,334,248 | 134,759,084 | 101 | 1,043,897 | 105,433,572 | M. Holliday | 20.856 | 16.32 |
| 2001 | ARI | 1,344,366 | 138,469,721 | 103 | 1,137,892 | 85,247,999 | R. Johnson | 21.928 | 13.50 |
| 2017 | HOU | 1,334,646 | 149,480,381 | 112 | 1,137,892 | 127,443,900 | J. Verlander | 32.841 | 28.00 |
| 2006 | STL | 1,348,606 | 126,768,972 | 94 | 945,653 | 88,891,371 | A. Pujols | 19.966 | 14.00 |
| 1999 | NYY | 1,395,306 | 152,088,424 | 109 | 808,539 | 88,130,709 | B. Williams | 17.01 | 9.86 |
| 2000 | NYY | 1,583,358 | 155,169,114 | 98 | 948,350 | 92,938,260 | B. Williams | 20.631 | 12.35 |
| 2021 | ATL | 1,640,403 | 162,399,874 | 99 | 1,546,065 | 153,060,458 | F. Freeman | 23.342 | 22.00 |
| 2016 | CHC | 1,759,483 | 200,581,099 | 114 | 1,468,808 | 167,444,167 | J. Lester | 29.947 | 25.00 |
| 2004 | BOS | 1,777,496 | 193,747,104 | 114 | 1,167,876 | 127,298,500 | M. Ramirez | 34.245 | 22.50 |
| 2013 | BOS | 1,816,570 | 196,189,557 | 108 | 1,471,919 | 158,967,286 | J. Lackey | 24.621 | 15.95 |
| 2007 | BOS | 1,853,482 | 198,322,620 | 107 | 1,336,693 | 143,026,214 | M. Ramirez | 23.595 | 17.01 |
| 2014 | SFG | 1,891,424 | 187,251,017 | 99 | 1,557,433 | 154,185,878 | M. Cain | 25.301 | 20.83 |
| 2019 | WSH | 2,112,088 | 221,769,206 | 105 | 1,878,130 | 197,203,691 | S. Strasb. | 43.108 | 38.33 |
| 2020 | LAD | 2,140,743 | 119,881,625 | 56 | 1,927,096 | 107,917,397 | C. Kershaw | 18.116 | 16.30 |
| 2018 | BOS | 2,267,276 | 269,805,843 | 119 | 1,980,247 | 235,649,368 | D. Price | 34.436 | 31.00 |
| 2009 | NYY | 2,368,113 | 269,964,844 | 114 | 1,767,098 | 201,449,189 | A-Rod | 44.223 | 33.00 |
(NOTE: Payroll and salary figures via Baseball Prospectus and Spotrac. The 2022 figures have been calculated through the March CPI index. CPW (Cost Per Win) and PR (Payroll) figures rounded off to nearest dollar. There was no World Series in 1994 due to the players' strike.)
Used 28 Times Today GAMBLING PROBLEM? CALL 1-800-GAMBLER or 1-800-MY-RESET (AZ, CO, IL, IN, KS, KY, LA, MD, MI, MO, NC, NJ, OH, PA, TN, VA) or 1-800-BETS OFF (IA). Call 1-800-NEXT-STEP (AZ). Call 1-800-9-WITH-IT (IN). CALL 1-877-770-STOP (LA). 21+ only (18+ in KY). Please gamble responsibly. Must be present in AZ/CO/IA/IL/IN/KS/KY/LA (select parishes)/MD/MI/MO/NC/NJ/OH/PA/TN/VA. Licensee partner Amelia Belle Casino. Minimum $10 deposit required. Minimum odds -500 or greater. Bonus Bets wager excluded from returns. New customers only. T&Cs, time limits and exclusions apply.
Bombers Deliver On Both Ends
The highest adjusted CPW of all teams that have won the World Series since 1992 belongs to the 2009 New York Yankees.
Those Bombers won 119 games including the postseason in claiming their only World Series title of the 21st Century. They have a 2022-adjusted CPW of $2,368,112.65, which was $1,767,098.14 in 2009 dollars. The 2009 Yankees also have the highest inflation-adjusted payroll at $269,964,844 in today's dollars.
That 2009 Yankees roster included Alex Rodriguez. His 2009 salary of $33 million would equal $44,223,756.28 today.
The 2003 Marlins beat the Yankees in the World Series. The Yankees payroll that season was $152,749,814, or more than triple the Marlins total roster cost of $49,050,000.
The 2018 Boston Red Sox have the highest overall payroll of any team on this list in today's dollars. The Red Sox spent $235,649,368 in 2018, but it was well worth it. Boston won a franchise-record 108 games in the regular season before beating the Yankees and Astros in the AL playoffs. The Red Sox ousted the Dodgers in five games to win the World Series. Their 2018 payroll equates to $269,805,843 in 2022 dollars.
Used 28 Times Today GAMBLING PROBLEM? CALL 1-800-GAMBLER or 1-800-MY-RESET (AZ, CO, IL, IN, KS, KY, LA, MD, MI, MO, NC, NJ, OH, PA, TN, VA) or 1-800-BETS OFF (IA). Call 1-800-NEXT-STEP (AZ). Call 1-800-9-WITH-IT (IN). CALL 1-877-770-STOP (LA). 21+ only (18+ in KY). Please gamble responsibly. Must be present in AZ/CO/IA/IL/IN/KS/KY/LA (select parishes)/MD/MI/MO/NC/NJ/OH/PA/TN/VA. Licensee partner Amelia Belle Casino. Minimum $10 deposit required. Minimum odds -500 or greater. Bonus Bets wager excluded from returns. New customers only. T&Cs, time limits and exclusions apply.
About the Author

 World Cup Golden Boot Odds: Record Breaker Messi Favourite Over Mbappe, Haaland, Kane
  Sky Bet Free Bets for World Cup: Get 50/1 on a Goal in Scotland vs Brazil
  2026 World Cup Golden Ball Odds: Messi Favourite After 5 Goals in 2 Games
  Best New Online Slots in the UK Ranked by Experts June 2026
  Top 10 Highest Payout UK Slots Ranked By Experts June 2026
  Ladbrokes World Cup Betting Offer: Bet £5, Get £30 in World Cup Free Bets
Comments